I’ve been attending an exoplanet data conference this week, a gathering between astrophysicists and statisticians. One way to look for exoplanets is by the “Transit” method. Basically a dip in the flux from a star is observed as an orbiting planet passes across the line of sight between the observer and the star. There was a lot of talk about automated methods of detecting this dip in brightness. I decided to code this up for the lulz:
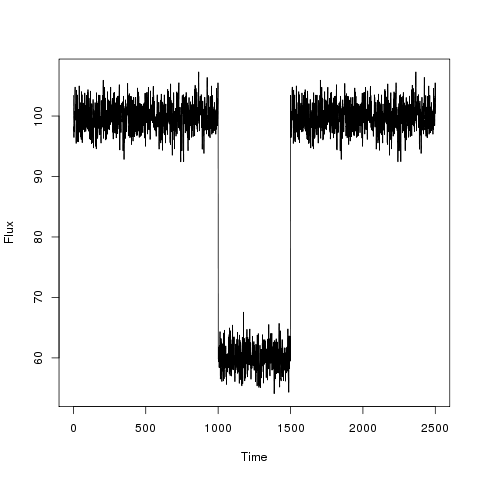
First I generated some fake data.

The dip in flux is meant to be as the exoplanet passes between the observer and the star. Interesting parameters are the dip in flux and the time interval of the reduced flux as these correspond to physical parameters of the planet-star system. I decided to model this as a simple changepoint problem:
Parameters of interest are b_1, b_2, tau_1 and tau_2, which are the baseline, the drop, the time at which the drop occurs and the time at which the drop finishes respectively. I proceeded using the following JAGS code:
model
{
for(t in 1 : N)
{
D[t] ~ dnorm(mu[t],s2)
mu[t] <- b[1] - step(t - tau1)*step(tau2-t)*step(tau2-tau1) * b[2]
}
b[1] ~ dnorm(0.0,1.0E-6)T(0,)
b[2] ~ dnorm(0.0,1.0E-6)T(0,b[1])
tau1 ~ dunif(1,N)
tau2 ~ dunif(tau1,N)
s2 ~ dunif(0,100)
}
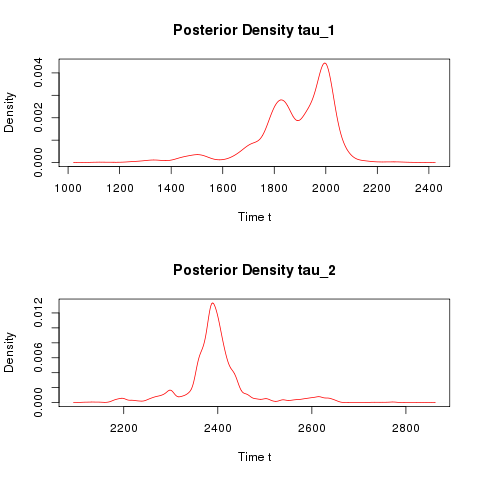
The script to generate the data and call JAGS from R can be found here. The posterior density estimates are displayed below:

The Bayesian change point model correctly identifies a drop of 40 and the times at which the transit begin and finishes. One might argue that such a large drop in flux is unphysical for detecting Earth like planets, so here is a further example to detect how robust this approach is. Consider the following light curve:

Can you tell by eye how deep the drop is, when it occurs and for how long? Here are the posterior density estimates:


The true valies with which the light curve was generated are